A data-driven investigation into the February 2026 conversion anomaly in the Vegamour Google Ads account.
Conversions jumped 786% overnight while ad spend stayed flat. That's physically impossible in real advertising.
On Feb 12, the account recorded 2,665 conversions on approximately 2,500 clicks. That implies a 106% conversion rate — meaning every single click converted, and some converted twice. This is physically impossible.
Green bars = normal. Red bars = anomaly. The spike is unmistakable.
You cannot get 786% more conversions from 8% more spend. The extra conversions did not come from ads — they were imported into the tracking system from an external source (Shopify webhook batch import of historical transactions).
If this were a real sale event, all purchase types would spike together. Only the Shopify webhook action (vega Sales) was affected.
| Date | vega Sales Conv | vega Sales Value | Subscription Conv | Sub Value | Flag |
|---|---|---|---|---|---|
| Feb 8 | 234 | $21,690 | 5 | $158 | Normal |
| Feb 9 | 871 | $34,774 | 6 | $186 | ⚠️ 3.7× spike |
| Feb 10 | 1,790 | $50,002 | 0 | $0 | ⚠️ 7.7× spike |
| Feb 11 | 2,521 | $61,723 | 1 | $54 | ⚠️ 10.8× spike |
| Feb 12 | 2,664 | $63,632 | 1 | $164 | ⚠️ 11.4× spike |
| Feb 13 | 918 | $42,724 | 13 | $152 | ⚠️ 3.9× spike |
| Feb 14 | 126 | $14,209 | 1 | $125 | Normal |
Key finding: The Subscription action tracked normally throughout the anomaly (0–13 conv/day, consistent with baseline). Only the vega Sales action — which receives data via Shopify webhook — spiked. This confirms the source was a Shopify data import, not real ad-driven purchases.
| Date | Spend | Conv | Conv Value | ROAS | Conv/$1K |
|---|---|---|---|---|---|
| Feb 1 | $8,567 | 206 | $22,552 | 263% | 24.0 |
| Feb 2 | $7,291 | 238 | $20,528 | 282% | 32.7 |
| Feb 3 | $7,753 | 218 | $23,086 | 298% | 28.2 |
| Feb 4 | $5,654 | 183 | $17,938 | 317% | 32.3 |
| Feb 5 | $5,768 | 217 | $17,347 | 301% | 37.6 |
| Feb 6 | $6,359 | 159 | $15,690 | 247% | 25.0 |
| Feb 7 | $5,854 | 202 | $17,390 | 297% | 34.4 |
| Feb 8 | $6,451 | 240 | $21,911 | 340% | 37.2 |
| Feb 9 | $5,962 | 877 | $34,960 | 586% | 147.1 |
| Feb 10 | $6,723 | 1,790 | $50,002 | 744% | 266.3 |
| Feb 11 | $8,107 | 2,522 | $61,777 | 762% | 311.2 |
| Feb 12 | $8,979 | 2,665 | $63,795 | 711% | 296.8 |
| Feb 13 | $7,017 | 931 | $42,876 | 611% | 132.6 |
| Feb 14 | $7,856 | 127 | $14,334 | 182% | 16.2 |
| Feb 15 | $3,678 | 236 | $27,609 | 751% | 64.1 |
| Feb 16 | $5,437 | 210 | $23,003 | 423% | 38.6 |
| Feb 17 | $7,568 | 175 | $18,828 | 249% | 23.1 |
| Feb 18 | $8,614 | 184 | $22,156 | 257% | 21.3 |
| Feb 19 | $6,880 | 159 | $17,745 | 258% | 23.1 |
| Feb 20 | $8,804 | 146 | $18,508 | 210% | 16.5 |
| Feb 21 | $8,266 | 231 | $24,264 | 294% | 28.0 |
| Feb 22 | $9,086 | 189 | $21,459 | 236% | 20.7 |
| Feb 23 | $5,669 | 198 | $18,763 | 331% | 34.9 |
| Feb 24 | $8,138 | 214 | $26,483 | 325% | 26.3 |
| Feb 25 | $10,007 | 228 | $26,750 | 267% | 22.8 |
| Feb 26 | $8,695 | 174 | $19,930 | 229% | 20.0 |
| Feb 27 | $9,698 | 215 | $24,438 | 252% | 22.2 |
| Feb 28 | $9,176 | 148 | $16,116 | 176% | 16.1 |
Cost (blue) stays flat. Conversions (orange) and Revenue (green) spike dramatically — then crash back to normal.
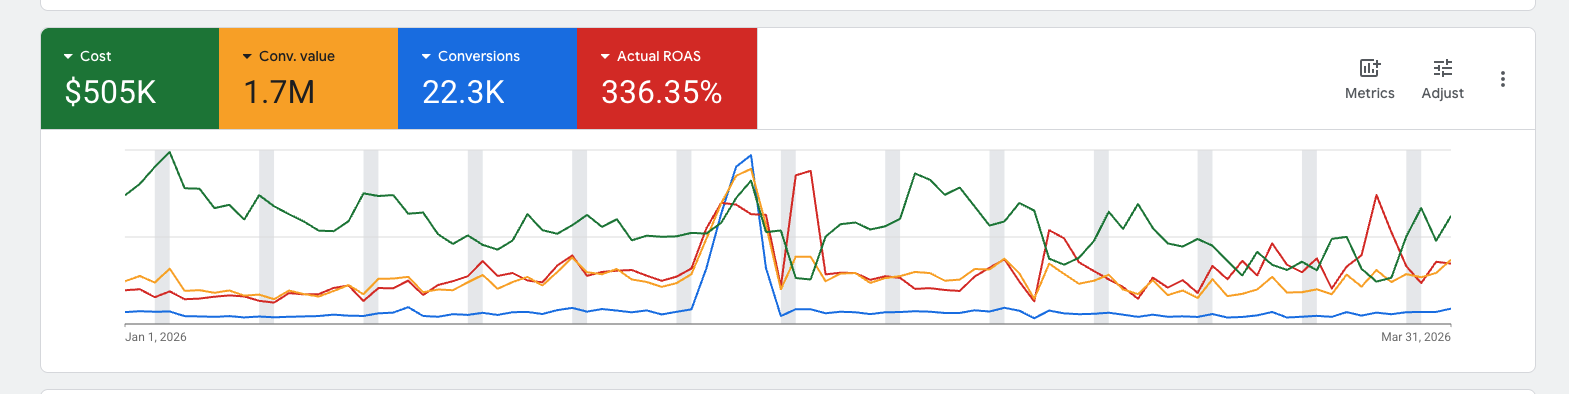
Includes ~$156K phantom revenue
from batch-imported historical transactions
Based on actual ad-driven purchases
excluding the Feb 9–13 batch import